COVID-19 as a data problem and how to react in the face of uncertainty
 Photo credit: Brian McGowan
TLDR
- COVID-19 poses an unprecedented challenge because there are many layers of uncertainty:
- It’s a novel coronavirus and scientists are still studying it
- It’s hard to detect and contain, due to a wide range of incubation periods and limited testing in most countries
- When there is uncertainty and constantly changing information, the correct response is not to reject everything and change nothing, but to understand the underlying assumptions that changed. You can contribute by staying informed and staying cautious, with data and your actions, even as things get better.
- Data does not eliminate uncertainty. Early population statistics may not be representative of all subgroups, all risk factors, or specifically the ones that apply to you. They are meant to be monitored over time.
- Missing data is not the same as false. Asymptomatic infections are a primary example of systematic missingness from reported cases, despite growing evidence that they make up a significant proportion of infections and have an insidious role in community transmission.
- Widespread testing regardless of symptoms would solve the detection problem with COVID-19, and put us on the most responsible and immediate path out of quarantine. Until then, we don’t know enough to decide who can safely come out of quarantine without risking another peak.
About me: I am a data scientist, and I analyze and interpret data for hereditary disease risk modeling at Color, which recently launched a COVID-19 testing lab. I am not an epidemiologist or medical expert, but the authors of many sources referenced here are. I also listed some reliable sources of data at the end. Thanks to Gilad Mishne, Anjali Zimmer, and Yang Su for their feedback on this post.
Misinformation can be particularly harmful during a pandemic, and major tech companies are working to stop #fakenews in its tracks. With COVID-19, even #realnews can change within the hour as our understanding around the world evolves. COVID-19 also poses an unprecedented data and modeling challenge because there are many layers of uncertainty:
- It’s a novel coronavirus and scientists are still developing an understanding of how to prevent and treat it
- It’s hard to detect and therefore hard to contain, due to a wide range of incubation periods (2-14 days from transmission to first symptoms) and limited testing in most countries
In this article, I frame COVID-19 as a data problem and talk about ways to leverage credible data even as they change. What are some ways to be more critical of statistics presented early on as the entire world, the WHO, the CDC, your local health departments, your favorite news outlets, and your favorite Twitter influencers are all watching COVID-19 unfold? More importantly, how should the presence of uncertainty influence the way you react during these crucial times?
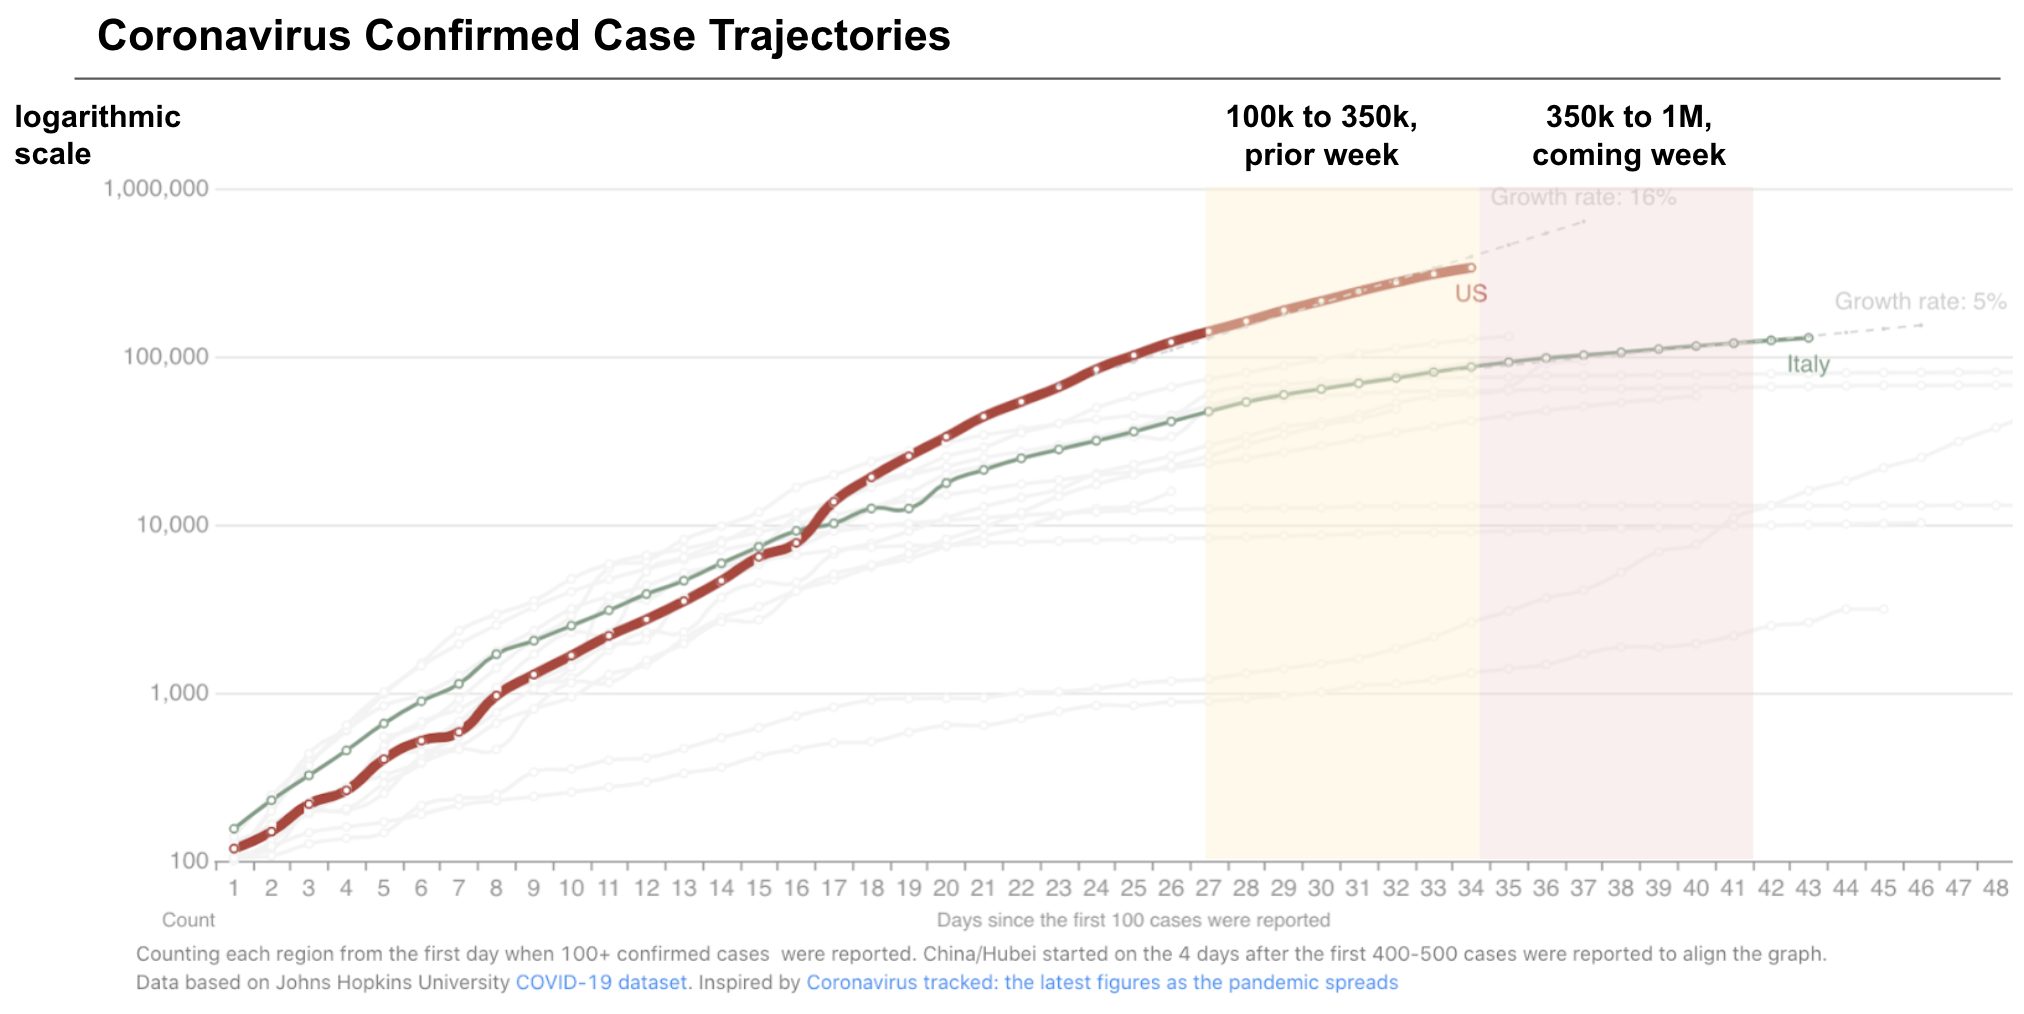 Source: 1Point3Acres on Apr 6, based on data from JHU. This explains how to read this chart and why it’s plotted logarithmically.
For better or for worse, we are now far along enough in the trajectory for exponential growth to be clear and put into perspective. At the beginning of last week, the US was concerned with growing cases around 100k. By the end of this week, we may be approaching 1 million cases if the growth remains uncurbed, and not even adjusting for undercounting from lack of testing. This means that increasingly drastic measures need to be taken, and the guidelines or best practices today may change before we know it. No matter how many credible articles and Dr. Fauci videos you’ve read and watched up until now, the guidelines will quickly change over time because the situation will get (exponentially) worse.
In the US, we were initially told in Feb to avoid travel, which progressed to frequent hand washing, social distancing, mandatory shelter-in-place (still not in all US states at the time of writing), and perhaps finally, mask-wearing. The next sensible thing might be something silly like wiping down your fruit 🧼🍍🤔. It sounds like an overreaction, but that’s what we thought a few weeks ago too.
We can endlessly blame China for covering up early cases or the US for not reacting quickly enough. Political agendas aside, exponential growth is hard for anyone to reason about intuitively, and we can still make up for lost time. When there is uncertainty and constantly changing information (about rates, projections, etc.), the correct response is not to reject everything and change nothing, but to pay attention to the underlying assumptions that changed or differed from one population to another. Doing the right thing in this pandemic may feel like overreacting, but we need disruptive intervention to combat exponential growth and high uncertainty.
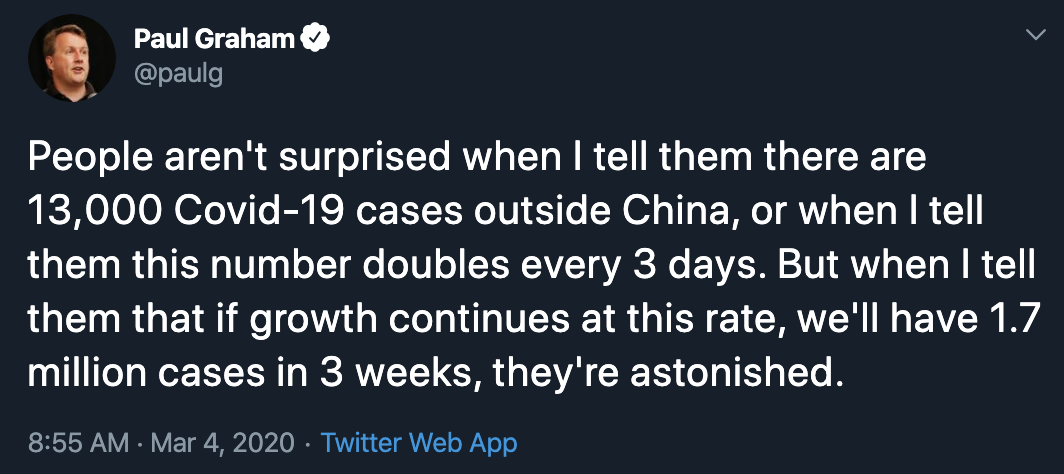 Exponential growth is hard to reason about intuitively. Source: Twitter
When there is data, stay cautious early on
Early population statistics are meant to be monitored over time
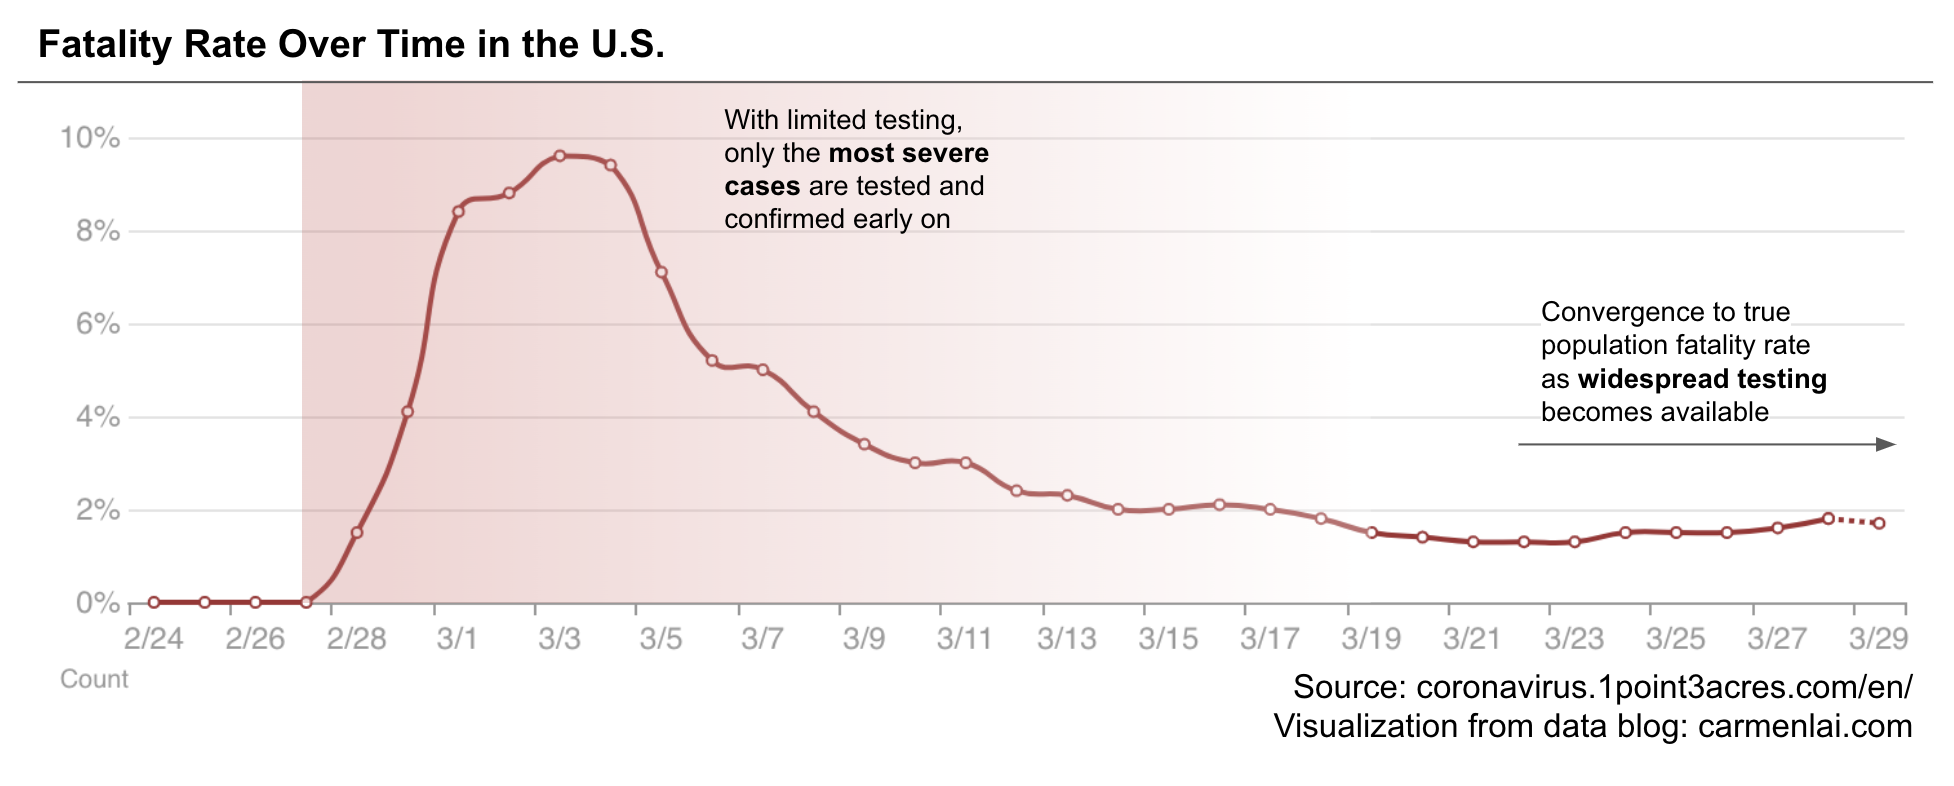
With so many numbers flying around, it can be hard to understand the full extent of COVID-19 risk. Early reported case-fatality rates (the number of deaths as a proportion of the number of known cases, hereon referred to as “fatality rate”) have changed over time as we increased testing. The fatality rate appeared much higher a few weeks ago when the US first began testing, has since decreased to around 2%, and will continue to fluctuate until we do widespread testing. Earlier numbers disproportionally reflect prioritization of limited tests to those with the most severe symptoms. To understand the true fatality rate and associated risk factors, we need to not only test more people, but also test a representative sample of the population — sick or healthy, young or old, and from different regions.
Fatality rates vary widely by location
Reported fatality rates also differ by region and country, due to reasons external to the disease itself. In the US, the fatality rate in New York is 1.5x that of California’s (3.6% vs. 2.3%). Both New York and California are coastal states with diverse populations, but they differ in density, hospital resource availability, and dominant work industries, all of which affect fatality rates. Someone who works a tech job in SF will have an easier time abiding by shelter-in-place than someone who runs a food stand in NYC to make a living. The difference among countries is even more staggering. Italy has a fatality rate 8x that of Germany’s (12.4% vs. 1.5%). This is due to differences in age distribution, prevalence of underlying conditions (hypertension, diabetes, etc.), and of course, testing policies.
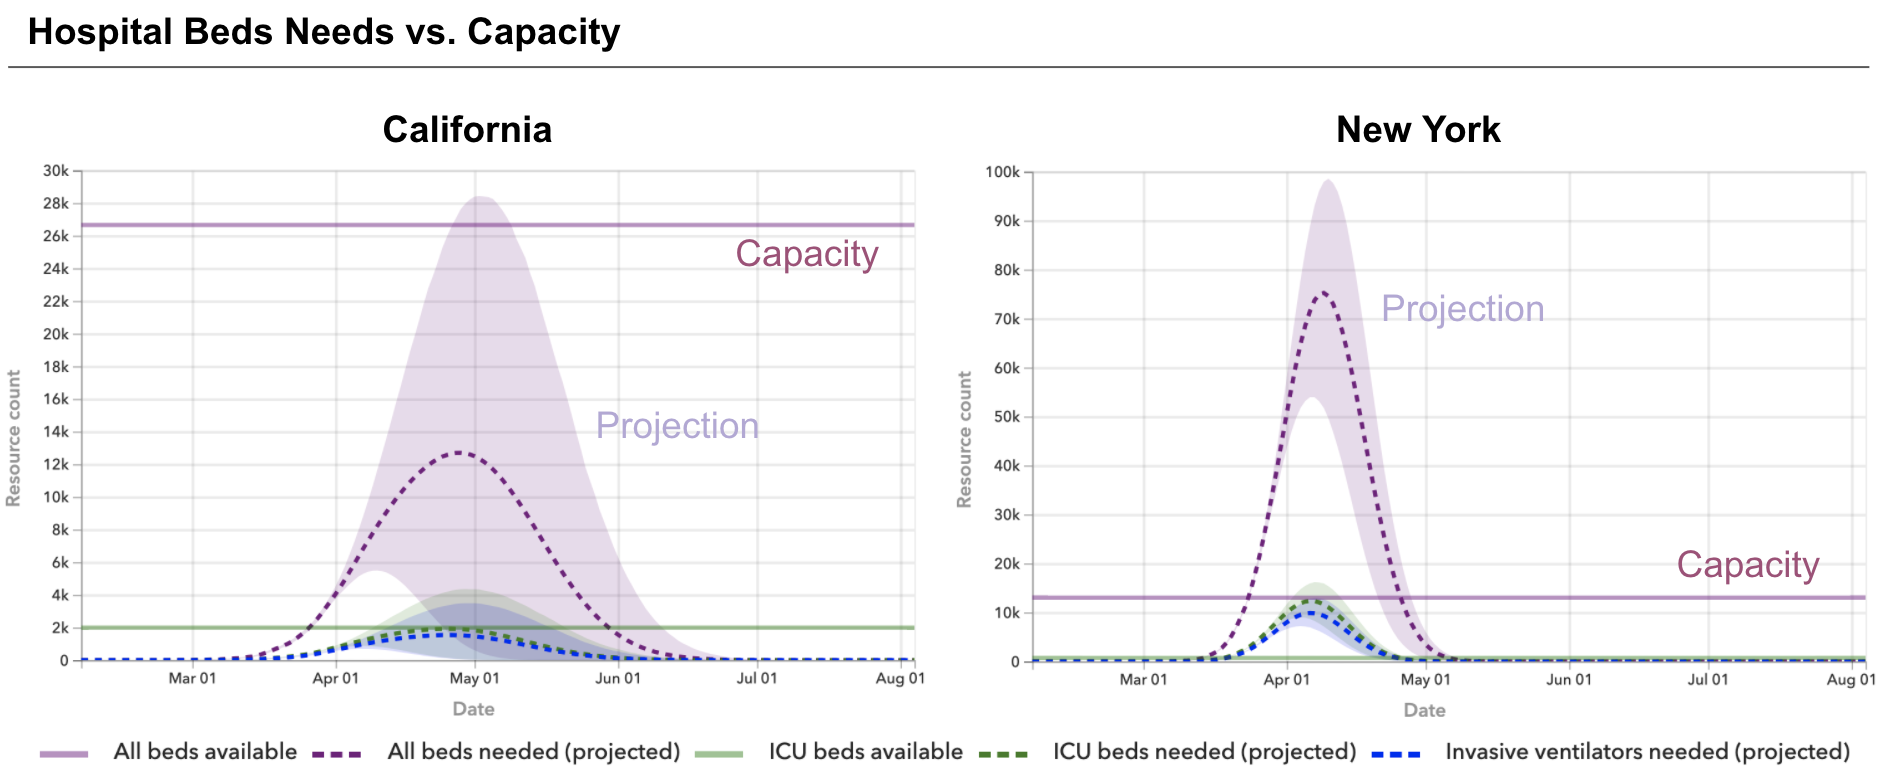 Regional differences in hospital resource availability can also impact fatality rates. Source: covid19.healthdata.org
We don’t know all risk factors and how they differ between people yet
Having initial data does not eliminate uncertainty. Even conclusions made from studies with large sample sizes and good experimental design may not be representative of all populations, all risk factors, or specifically the ones that apply to you. We currently have enough data to conclude that age and underlying health conditions (diabetes, hypertension, respiratory diseases, etc.) are risk factors for COVID-19 in terms of fatality or severity of disease. However, there are still a number of open questions about other risk factors (obesity, pregnancy, smoking, and seasonality, etc.), and data is particularly sparse for younger populations due to limited testing. For example, we know that a 20-something-year-old is likely to have low risk, but what if he or she has a smoking problem and lives in a COVID-friendly climate? We don’t know enough to make conclusions about specific individual risk for many people, particularly those with more complex risk factors, and we aren’t going to get answers for free with the current testing approach.
When there is a lack of data, it may be due to systematic missingness
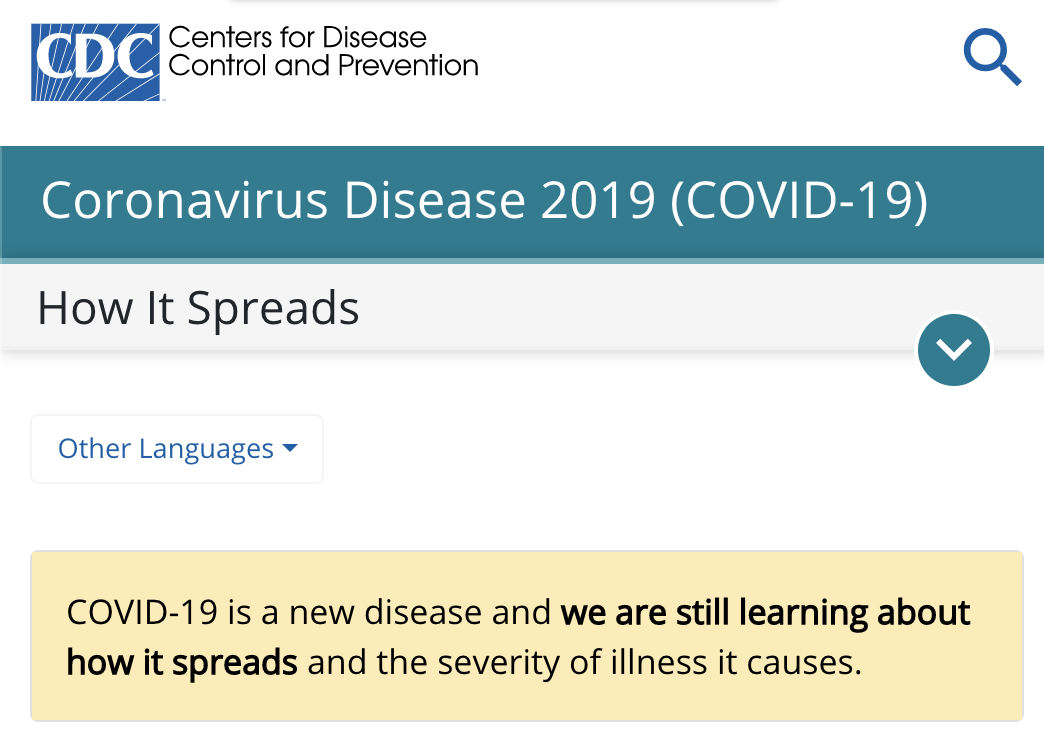 We are still learning. Source: cdc.gov
Incomplete data: missing is not the same as false
There is a lot we still don’t know about how COVID-19 is transmitted (how incubation periods vary, when it’s the most contagious, persistence on substrates or surfaces, asymptomatic viral shedding, seasonality, etc.). Currently recorded cases do not reflect alternative modes of transmission, but that does not imply that they are false or unfounded. There may be systematic missingness of certain data due to non-random testing. Asymptomatic infections are a primary example of the detection problem with COVID-19, which were initially reported to be as low as 1% of cases and described as “rare” in a WHO report. Separately, China’s definition of “confirmed cases” has also excluded asymptomatic infections from their reported numbers until recently, when contact tracing of new cases revealed asymptomatic spread. As more research is published with data from testing regardless of symptoms, there is growing evidence that asymptomatic infections make up a significant proportion (Japanese researchers estimate 30%) of positive cases, and have an insidious role in community transmission with as high as 79% of infections in China from suspected asymptomatic sources.
Comprehensive data: widespread testing from a cruise ship outbreak taught us about asymptomatic cases
Perhaps the most comprehensive data we have to date for asymptomatic cases came from a perfect storm aboard the Diamond Princess cruise ship outbreak. Prior to disembarking, nearly all 3k+ passengers were tested regardless of symptoms. Researchers found that 46% of positive cases were asymptomatic at the time of testing and further analysis estimated that 18% of positive cases never developed symptoms, and were truly asymptomatic rather than pre-symptomatic. While this information doesn’t confirm transmission via asymptomatic spreaders, the prevalence detected here is notably different from earlier population estimates, and give scientists good reasons to investigate further.
Mask-wearing is especially important given asymptomatic evidence
Mask-wearing becomes increasingly important if there is in fact high prevalence of asymptomatic infections, particularly for young people who may have mild or no symptoms, aren’t respecting social distancing, and are contributing to community spread. The CDC previously did not recommend mask-wearing for healthy individuals, citing that there is no evidence to support that mask-wearing is effective in a public setting. Perhaps the lack of evidence for masks in a public setting is another example of systematic missingness: if there is stigma around mask-wearing and being sick, then people won’t wear masks, and we won’t observe its effect in the population.
 Early sentiment on mask-wearing in the US. Source: Twitter
However, population-level data on masks is also limited in other countries. One meta-analysis study published years after the SARS outbreak in 2003 concluded that mask-wearing of any kind was 68% effective, compared to hand-washing 10+ times a day at 55% effectiveness. While there is research evidence (and perhaps common sense) that point to mask-wearing as beneficial for the community, worldwide PPE shortages for frontline healthcare workers is also a reality and an important consideration. The CDC has since revised its stance on mask-wearing to recommend cloth face masks. If there is a high prevalence of asymptomatic spreaders in our community, mask-wearing coupled with current social distancing measures can prevent community spread more effectively, and in turn, reduce strain on the medical system.
We don’t know everything, but what can we do?
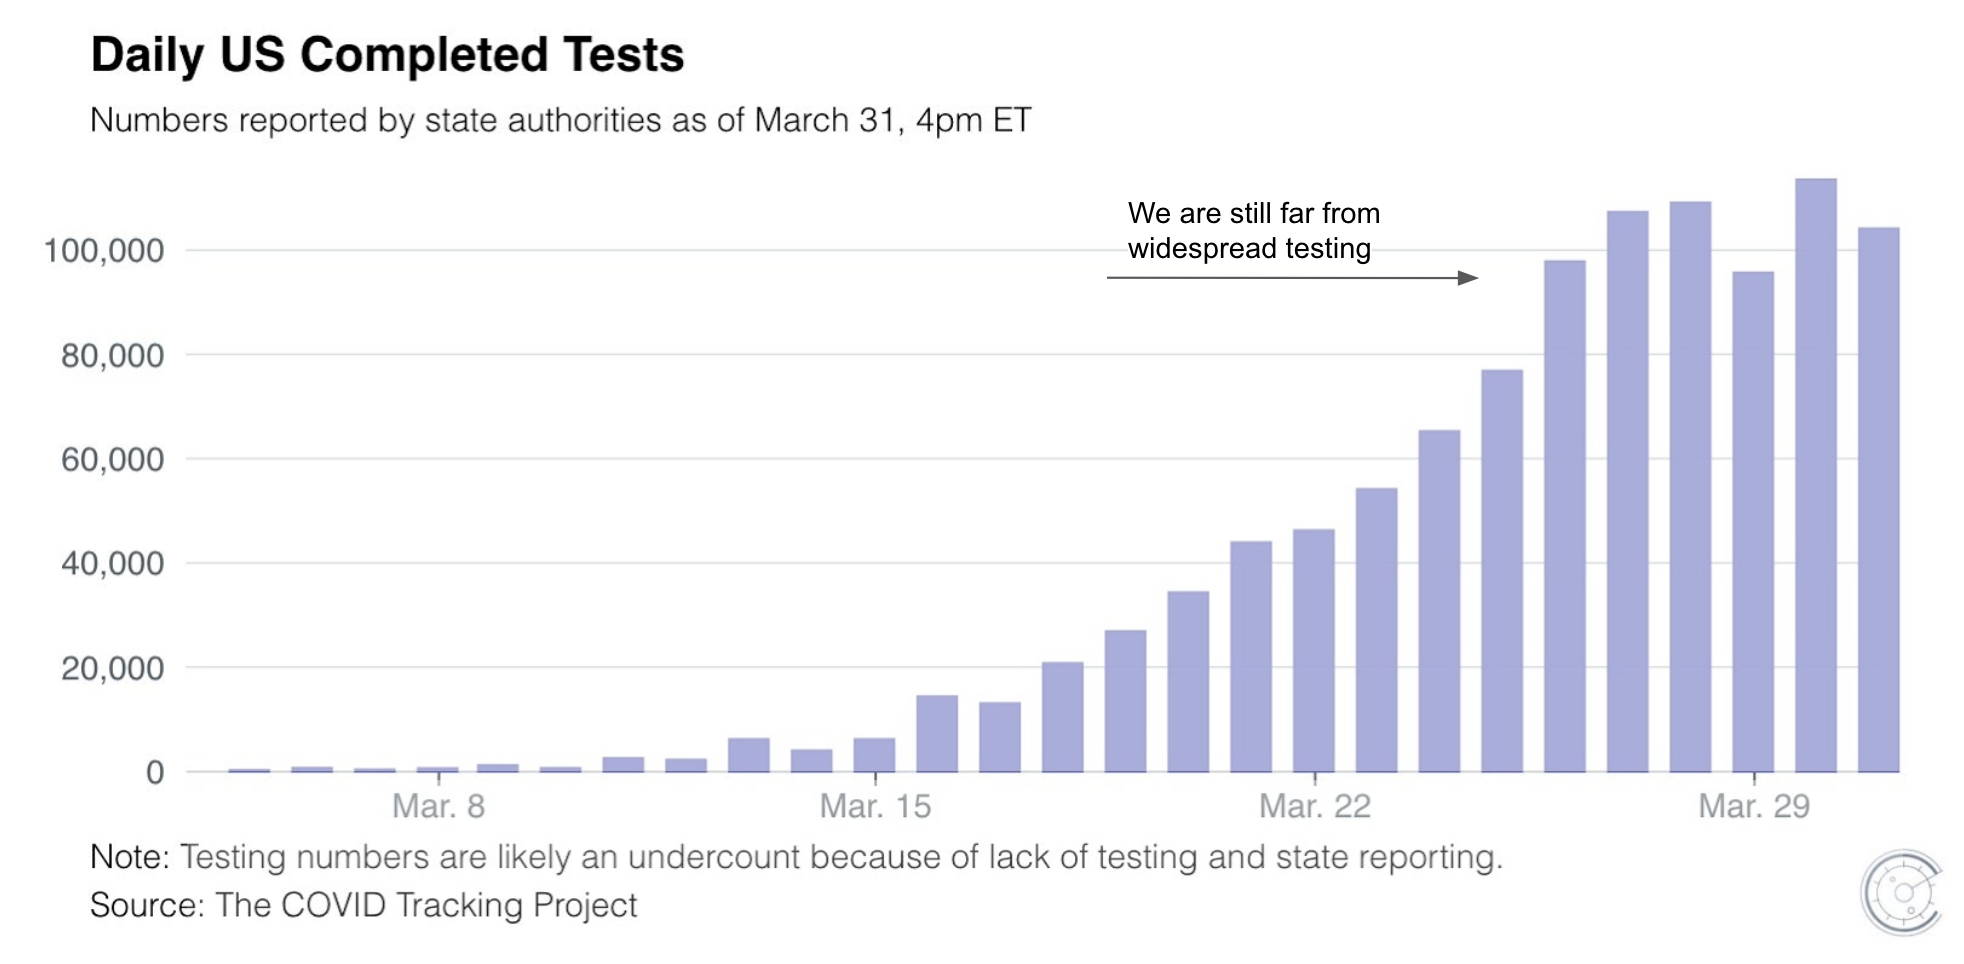
Widespread testing is the most responsible and immediate path out of quarantine
One way to eliminate uncertainty without conclusive answers to all research questions about COVID-19 is to test everyone and do so reliably. Until we have widespread testing, we cannot selectively decide who can safely come out of quarantine without risking another peak (recall: exponential growth is hard). There will be economic consequences as a result, but if we lift restrictions too soon, more people will die and the economy still suffers. Until new cases in the US start to decrease, strict non-essential business shutdown needs to continue and expand into states across the US that aren’t already enforcing it.
My goal with writing this post is to ask you to dig deeper past the headlines, stay cautious, and take data interpretation into your own hands <insert hand-washing pun 🧼👏>. I have listed some reliable resources on COVID-19 below for the curious. Lastly, here are some questions we can think about as COVID-19 continues to develop. Leave a comment with your thoughts!
- How has the case-fatality rate changed since this post, and why?
- How would you propose that we estimate the prevalence of asymptomatic cases in the US population, assuming current testing limitations?
- How does data translate to policy? How low do the new case numbers need to be for us to begin to relax social distancing measures?
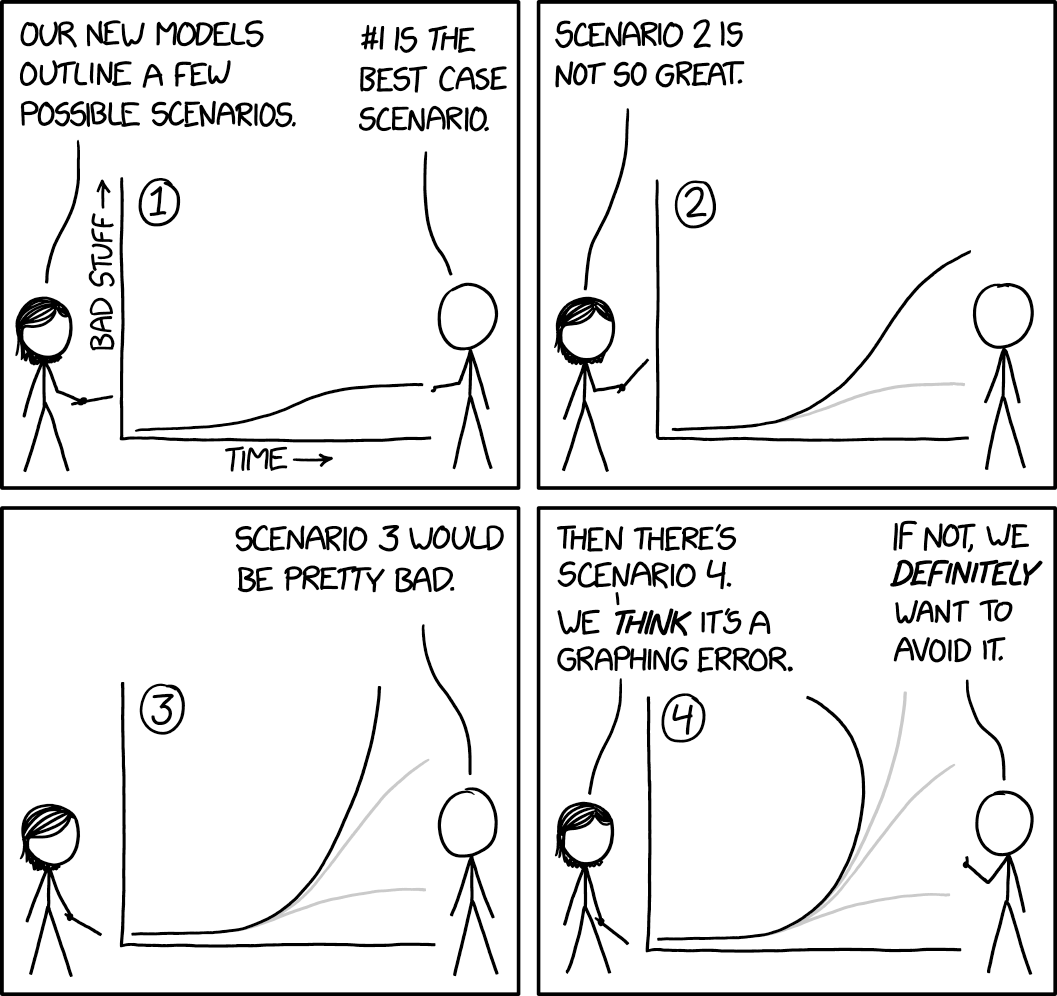 Last question: is Scenario 4 a graphing error or time travel?
Reliable sources of information
Here are sources of data that I have found reliable, without the sensationalist headlines.
Real-time tracking: US & Canada
- 1Point3Acres aggregates and fact-checks county-level data, which can often be ahead of state-reported data. They aggregate, fact check, and deduplicate data, and share their findings with the CDC.
- The COVID Tracking Project
Real-time tracking: World
Research and statistics
- CDC - Novel Coronavirus Reports
- Report of the WHO-China Joint Mission on COVID-19)
- Coronavirus: Why You Must Act Now - Thomas Pueyo
Guidelines and protocol
- Your local health department (ex: San Francisco Department of Public Health)
- Interviews with Dr. Anthony Fauci, NIAID Director
Disease and biology
Data analysis
- Kaggle provides a variety of datasets (on published literature, county-level populations, hospital resources, past outbreaks, etc.) and users can use this data to answer questions that are still unclear about COVID-19.
- News headlines archive, may be interesting to analyze sentiment over time